
Did you know?
90% of information sent to the brain is visual.
Everyone likes to look at pictures, and 40% of people respond better to visual information than text. Only 20% of text is remembered and 80% of people only skim online text.
Are you even still reading this or have your eyes already dropped to the graphic below?! ;)
How might your brand or organisation benefit from using infographics?
Infographics are a great way to illustrate data or statistics; summarise a long piece of text; explain a process; or to generally simplify a complex subject. By creating a story around your content, you can create a narrative for the reader to follow and understand your message better.
By using short and concise text and engaging visuals, it will be easier for your reader to digest and remember. And by including your logo and branding, it can be a really smart piece of marketing…even better if it goes “viral”!
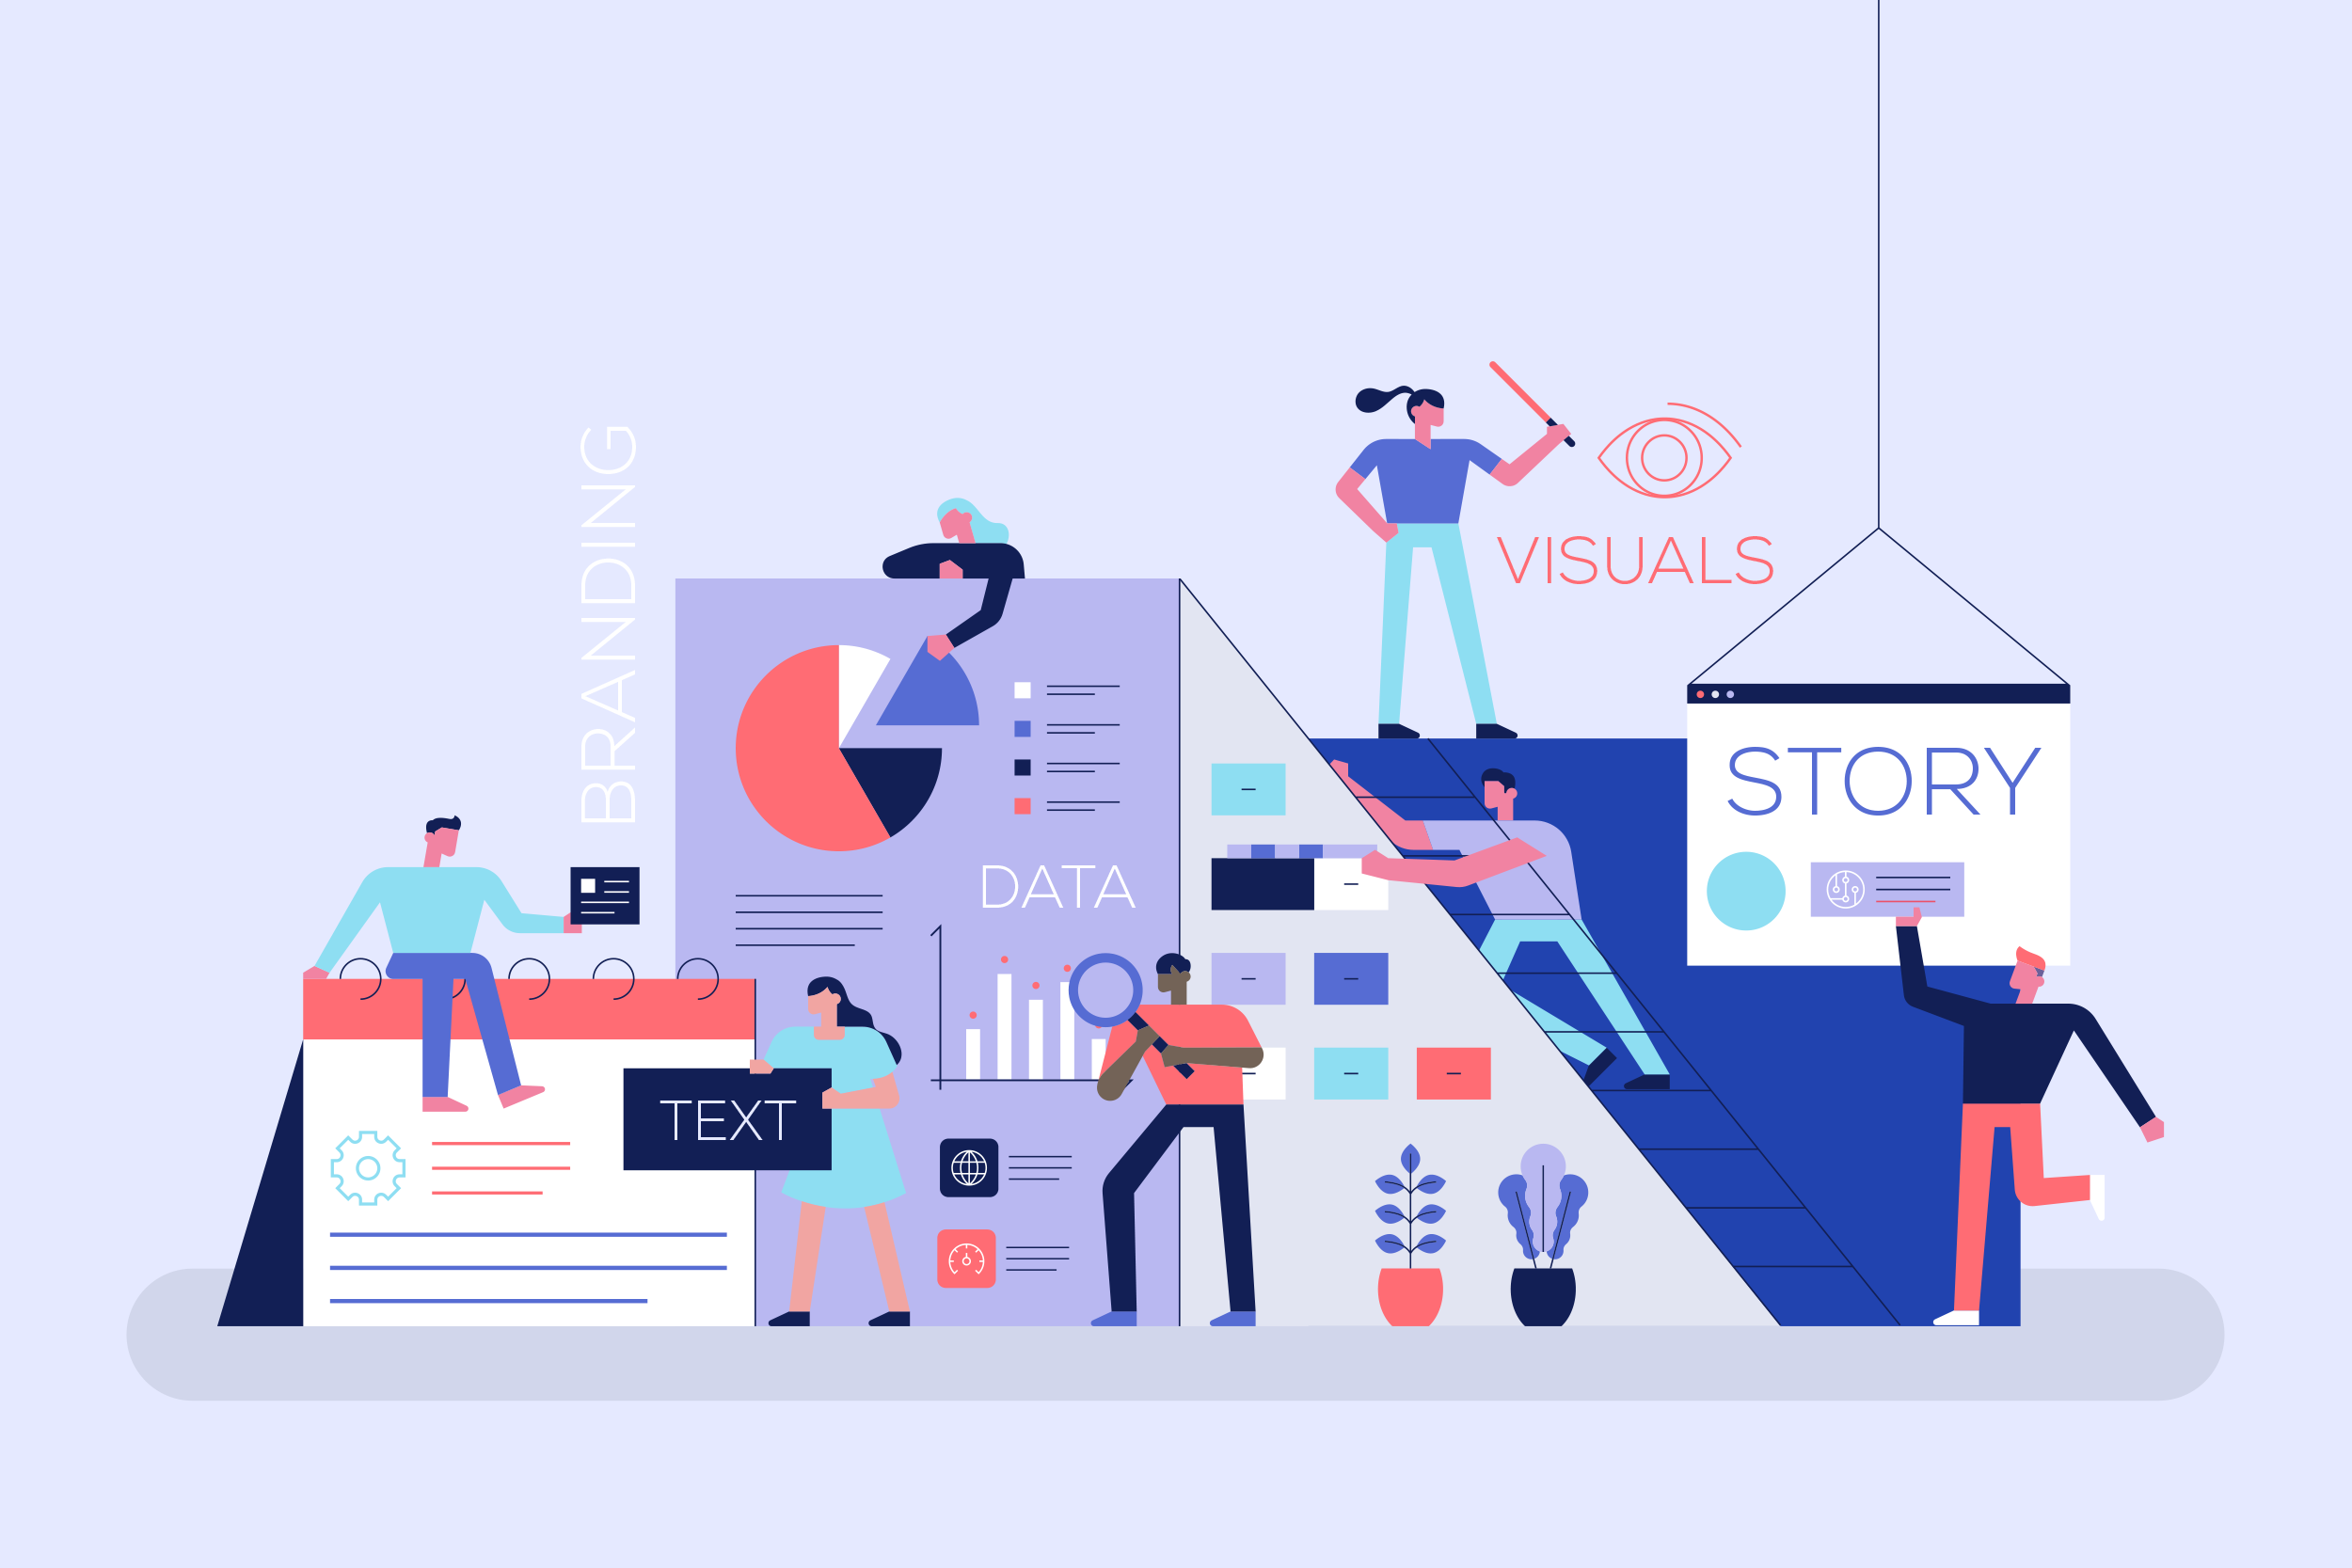
What makes a good infographic?
Narrative - tell your reader a compelling story
Data - support your message with interesting and reputable research
Visuals - use impactful illustrations, graphics and/or diagrams
Text - keep it short and simple
Branding - use the opportunity to increase your brand awareness
Read our detailed blog post about this topic for more insight.
What type of infographic is suitable for you?
There are many different types including statistical, process, geographical, timeline, comparison, anatomical and lists. Once you know what story you want to tell, it will be obvious which format will suit your infographic.
What is the process involved in creating an infographic?
1. Brainstorm the concept & idea
2. Research the data
3. Structure the narrative
4. Write the text
5. Wireframe design
6. Design & illustration
7. Proof & edit
8. Share to the world!
What’s the next step?
Contact Resonate Design for a chat!